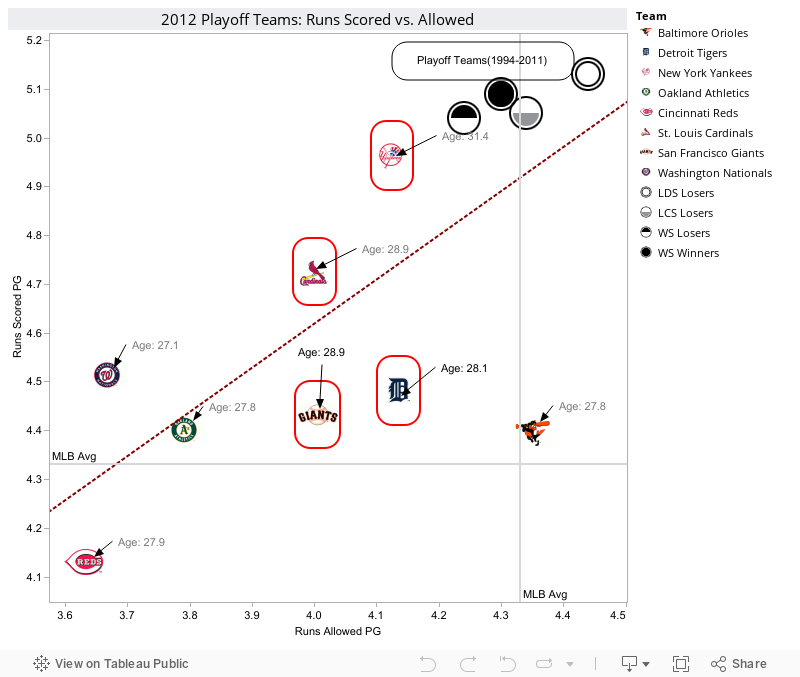
1. There is a wide contrast between the clubs, with the Yankees scoring almost 5 runs per game(2nd to Texas) and the Reds giving up only 3.63 runs(tops in MLB).
2. The numbers for the Washington Nationals, with the highest run differential of almost 0.9 RPG, support the fact that they finished with best record in baseball.
3. Teams from the American League give up more RPG than their National League counterparts, which reflects the overall difference(4.45 to 4.22) between the AL and NL.
4. The Baltimore Orioles are spot on the Major League average in both runs scored and allowed which is testimony to their gaudy 29-9 record in one-run contests.
5. Comparing the 2012 numbers to the averages for the playoff teams since 1994 is just more evidence that 2012 was indeed the year of the pitcher.
So which type of team will come away with a World Series title? An offense minded team like the Yankees or a team focused on pitching and defense like the Reds or Nationals? Or will it be a more balanced team like Detroit or the defending champion Cardinals? Would love to hear your observations and comments.
Pitching and defense dominated in first two games of the LDS as the Reds and Tigers came away with victories. We'll see if it continues.
ReplyDelete