Saturday, March 30, 2013

Elite Eight: Louisville is Sole Surviving #1 Seed

Louisville is the sole #1 seed remaining in a tournament that has had its fair share of surprises. But it was only 2 years ago that Kansas was in a similar role and they were subsequently sent home by the Cinderella #11 seed VCU.

As the chart below shows, it is rare to have only one remaining #1 seed by the time we reach the Elite Eight and more common to have all 4 remaining, like we did from 2007-2009. A more interesting measure is to compare the sum of the seeds, which is a rough indicator of both the parity in the field and, possibly more telling, how well(or not) the Selection Committee did in their seeding.  Comparing the totals, the Committee came in slightly worse than average this year. Best year: 2007. Worst Year(s): 1990, 2000.


Monday, March 25, 2013

Sweet 16: History In The Making

Some things you should know about this year's NCAA Men's Sweet 16:

1. Florida Golf Coast is the first #15 seed to reach the Sweet 16. #14 seeds have made it twice(1986 Cleveland St. lost to #7 seed Navy,1997 Tenn.-Chattanooga lost to #10 seed Providence)

2. Lasalle vs. Wichita State marks the first matchup of a #13 and #9 seed. #13 seeds have played #1 seeds 4 times and lost each time: 2012 Ohio(vs. UNC), 2006 Bradley(vs. Memphis), 1999 Oklahoma(vs. Michigan State), 1988 Richmond(vs. Temple).

3. Lasalle vs. Wichita State is the first matchup of non-power conferences since 2006, when George Mason beat Wichita State and Memphis beat Bradley.

4. This is the 4th year in a row that the Sweet 16 has had three double-digit seeds. It's pretty common, occurring 13 times since 1985.  There were 5 double-digit seeds in the 1999 Sweet 16(Gonzaga,Miami(OH), Missouri State, Oklahoma and Purdue).

5. Excluding results from the play-in round, teams in the 1st and 2nd rounds averaged 65.3 points per game which was the lowest total since 1985, the first year the tourney expanded to 64 teams. 

Tuesday, March 19, 2013

Tourney Time: First Round Results Validate Committee Seedings

The grid below shows the head-to-head win/loss records of the NCAA tournament teams by seed since 1985. Choose one or more values in the Rounds filter to see matchups in particular rounds.
 
Taking a look at the first round throughout history shows a a predictable pattern.  The #1 seed is 112-0 versus the #16 seed and the winning percentage decreases at a steady pace from there, with a noticeable exception of the #5 seed.  #12 seeds have upset the #5 seed just as often as the #11 seeds have upset the #6, and the #8-#9 matchups have been pretty even.  Despite the complaints over the years, these numbers appear to validate the selection committee seedings.


Monday, March 18, 2013

Tourney Time: Conference Matchups

The grid below shows the head-to-head records by conference in the NCAA torunament since 1985, winners by row and losers by column.  Select one or more of the values in the Rounds filter to see results for particular rounds.


A couple of observations:

1. The ACC, the top performing conference with a .647 overall winning percentage, has a winning record against every other conference with the exception of the SEC where it is only 15-25.
2. Head-to-head matchups of the same conference are rare.  Hard to believe that ACC teams have only met twice since 1985(in 1995 and 2001) and two PAC-12 teams have never met.
3. In games beyond the Sweet 16, the SEC is 8-3 against the ACC, the ACC is 11-1 against the Big 10 and the Big 10 is 9-1 against the Big East.

My next post will explore how the seeds have fared throughout history.

Sunday, March 17, 2013

Tourney Time: A Historical Look at the Conferences

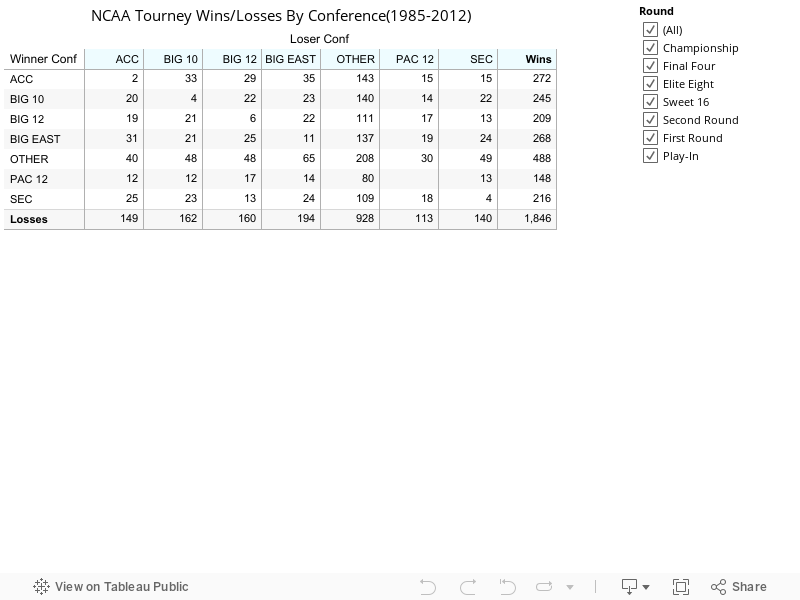
March Madness is upon us and I thought it would be a good time to look at what the numbers say over the history of the NCAA tournament since it was expanded to 64 teams in 1985. The first glance I will take is to compare wins and losses by the 6 power conferences and the group of teams belonging to other conferences, sometimes confusingly called mid-majors. The chart compares the winning percentage of each broken down by each particular round of the tournament. The number of appearances for each conference is shown in parantheses
.
A few observations:

1. Clicking on a conference in the color legend will highlight the results for the chosen conference. In general, winning percentage decreases as teams get deeper in the tournament, which is not surprising. There are a couple exceptions to this trend. For example, the Big 10 takes a big jump from the Sweet 16 to the Elite 8 and the SEC jumps to the head of the pack in the Final 4 and Championship rounds.

2. The power conferences have consistently outperformed the others in the First Round of the tournament, but the other conferences catch up to a degree as they get deeper, winning 6 of their 13 appearances in the Final Four.

3. Of the six power conferences, the Pac-12 is the worst performer in terms of both games played(252) and overall winning percentage(.567). A true comparison between the power conferences should probably take into consideration the number of bid opportunities, since there are differences in the number of teams in each conference through the years.

4. The ACC separates itself from the pack when comparing overall winning percentage, but that is mainly due to their high rate of success in the early rounds. They fall behind the Big 12 once they reach the Sweet 16.

5. The Big 12(which also includes teams from the SWC and Big 8 in the early years) takes the biggest jump from one round to the next, leading the pack in the Sweet 16(.604) and falling to the bottom(.394) in the next round.

Note: I ignored results from the Play-In rounds, which were just recently added to the tournament.

I'll take a look at head-to-head matchups in my next post.